Pictures of Chaos
August 28, 2020
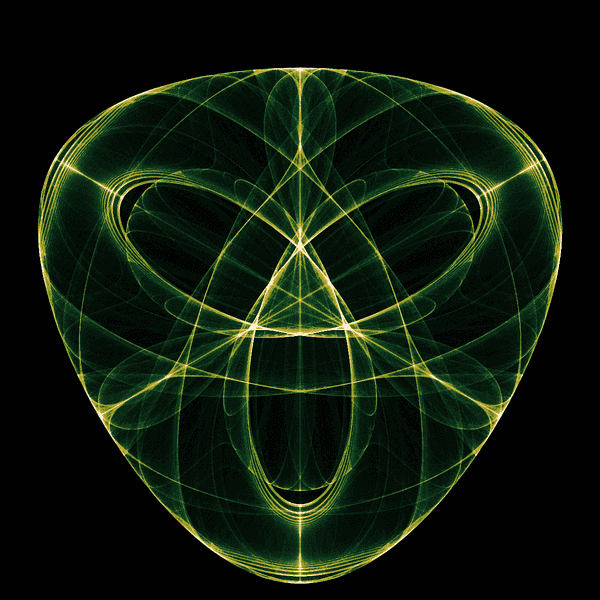
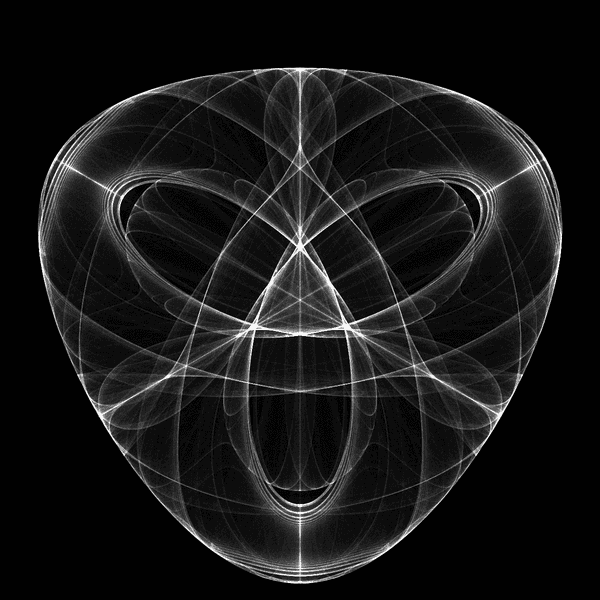
This image was generated by a Python program. In all of its swirling complexity and perfect symmetry, the designer is none other than a mathematical equation (though there is also an art in finding the equation!). The image's complex patterns find a succinct representation as
for complex-valued . But there's a catch: We're not graphing the above equation in the usual way, e.g., graphing as a line. Instead, we treat as a function which describes the evolution of a particle's path through two-dimensional space. More on this later.
My friend Siddy recently gave me the insightful book "Symmetry in Chaos: A Search for Pattern in Mathematics, Art, and Nature" by Michael Field and Martin Golubitsky. If you enjoy this post, I'd highly recommend it for further reading. The core techniques in this post are based on the book's treatment of "symmetric icons", and I adjust the process in a couple ways.
- I modify their rendering technique by coloring the icons with the GIMP image editing software.
- I animate the icons with dynamic, real-time visualizations of the particle motions. For example, try interacting with the following sketch.
The above interactive sketch is not a prerecorded video. Your browser is computing the paths of 10,000 points through a chaotic system whose parameters change when you drag the sketch.
Throughout this post, I'll describe the methods in more detail and provide graphics like this along the way.
A Bit on Chaos Theory
Chaos theory is the study of chaotic systems, though chaos does not have a universally agreed upon definition. Still, one property which many agree is necessary for a system to be called chaotic is "sensitive dependence" popularly known as the butterfly effect. The idea is that any two similar starting states will likely evolve along wildly different paths.
In this post, we make use of chaotic two-dimensional dynamical systems in particular. Before describing how the graphics are made, let's start by introducing some concepts.
Iterated Functions
In the intro, I mentioned that we were not drawing in the way we normally graph functions. is instead treated here as an iterated function.
Let be any function which sends complex numbers to complex numbers. Starting with , call , and in general . Using the natural mapping of to the Euclidean plane , then can be thought of as the two-dimensional position of a particle at time .
As a quick example, let and . Then, , , and so on.
Attractors
Attractors are features which arise from chaotic iterated functions. They are basins to which points tend to converge over their evolution through time. In the previous graphic visualizations, we saw points converging on interesting geometric curves. Here's another example demonstrating point-attractors. Note how all the particles eventually come to rest on exactly three points.
Symmetric Icons
A priori, there's no reason to expect an arbitrary iterated function to demonstrate interesting attractors. So what makes the above so special? Well, Field and Golubitsky cover this subject in great detail in their book! Here, I'll describe at a higher level what's going on and point you toward their book if you're interested in further reading.
The function is a particular instance of a more generic form.
for natural number and real-valued , , and . This function generates what Field and Golubitsky call symmetric icons. Symmetric icons demonstrate
- Sensitive dependence. Two points which start near each other will diverge in their paths.
- Attractors. Points tend to converge on certain subsets of the plane.
- Dihedral symmetry. The sort of symmetry we associate with regular polygons.
The last point is interesting: Though not always the case with chaotic systems, the particular function explored by Field and Golubitsky is one which forces symmetrical patterns to appear. This is a nice contrast to our previous series on Dice in which we explore how randomness can be derived from symmetry. Here, we see a sort of converse: How symmetry can be derived from chaos.

Why does this work?
The function respects the symmetry of the dihedral group , and this plays a critical role in the symmetrical pictures that result from it. To motivate this fact, let's first look at a simpler example.
Recall that a function is odd if . Intuitively, this says "flipping the input is the same as flipping the output". Examples of odd functions include and . So an odd function demonstrates a reflectional symmetry, and if we want to demonstrate other types of symmetries, then we turn our attention to groups.
Let be a group equipped with a group action on some set . Then we label a function as -equivariant if respects the symmetry described by . Formally, we require that for all and . Note the similarity to the definition of an odd function.
Let's restrict our attention to when and . Reflections and rotations of complex numbers are themselves represented nicely as complex operations. For a point , a reflection is the conjugate and a rotation by radians is .
Therefore, a -equivarant function would be one such that and . And indeed, the symmetric icon function was designed to precisely to satisfy these constraints. Furthermore, is the "simplest non-trivial" example of such a function. See Field and Golubitsky's book for more on the details of the derivation, but for now, I encourage you to verify that satisfies the symmetry equations!
Making the Graphics
To make the images in this post, I wrote a Python script to calculate over ~20,000,000 iterations starting from a random point near the origin. The program maps the particle's position at each iteration to a pixel and keeps track of the number of times each pixel is visited.
Since Python has built-in support for complex numbers, the code implementing reads similarly to the equation.
def next_coord(z, n, alpha, beta, gamma, lamb):z_bar = z.conjugate()scalar = lamb + alpha * z * z_bar + beta * (z ** n).realreturn scalar * z + gamma * (z_bar ** (n - 1))
The collection of the number of times each pixel is visited is pertinent as it provides a statistically inferred representation of the system's attractors. A pixel with a high visit count is likely to be part of an attractor.
Not all parameter values for lead to attractors. So it takes some experimentation to find parameters yielding interesting results.
After collecting the data, the visit counts are scaled to the range of 0 to 255 so that we can visualize the data as a grayscale image. I use the open source Pillow library to export the image from Python.

At this point, I then import the image into GIMP and apply a hand-tuned gradient map to colorize the image.
The Interactive Sketches
The sketches are written with p5.js in WebGL mode. The approach is similar to the image generation, but different in a key way: Instead of tracking a single particle and remembering its history, we track lots of particles and render only their current positions. This lets us experience the evolution of the chaotic system in real time. In doing so, we can better appreciate the macroscopic effects of chaotic systems, like how they seem to "bend" space to produce their attractors.
Dragging the sketches will slightly vary the parameters of . With slight variations in even a single variable, we see quite complex effects on the shapes of the attractors.
To wrap up, I'll leave you with one last sketch.
The sketch wonderfully demonstrates how sometimes there is no more than a fine line between a chaotic system that produces orderly attractors and one that instead expels all points to infinity.
Copyright © 2022 Robert Adkins. All rights reserved.